

Wildfire Risk Maps: Fighting Wildfire Risk with Aerial Imagery & GIS Modeling
Wildfire Risk Maps: Fighting Wildfire Risk with Aerial Imagery & GIS Modeling
Wildfire Risk Maps: Fighting Wildfire Risk with Aerial Imagery & GIS Modeling
Wildfire Risk Maps: Fighting Wildfire Risk with Aerial Imagery & GIS Modeling

Wildfires in the United States can have a devastating impact on people, property, and the environment. Wildfire risk maps may hold the key to helping mitigate costly damage.
The costs are significant. The five-year average cost to the Forest Service alone is over $2 billion, while the cost to Department of Interior (DOI) agencies was more than $525 million. Suppression costs for nine wildfires designated as major disasters from 2016 to 2020 averaged $394 million for hazard-mitigation efforts.
But the devastating effect of wildfires goes way beyond money lost. The destruction of homes, displacement of people from their communities, damage to animal and plant species, and loss of habitat for endangered species are some of the major non-monetary costs associated with wildfires.
What can be done to help limit loss? Fire risk maps help government agencies and private entities alike to better understand potential wildfire impacts and develop effective strategies for prevention and mitigation. These maps provide detailed information about vegetation types and land cover characteristics that can be used to identify areas most vulnerable to wildfire activity or areas where fuel management activities may be needed to reduce risk levels.
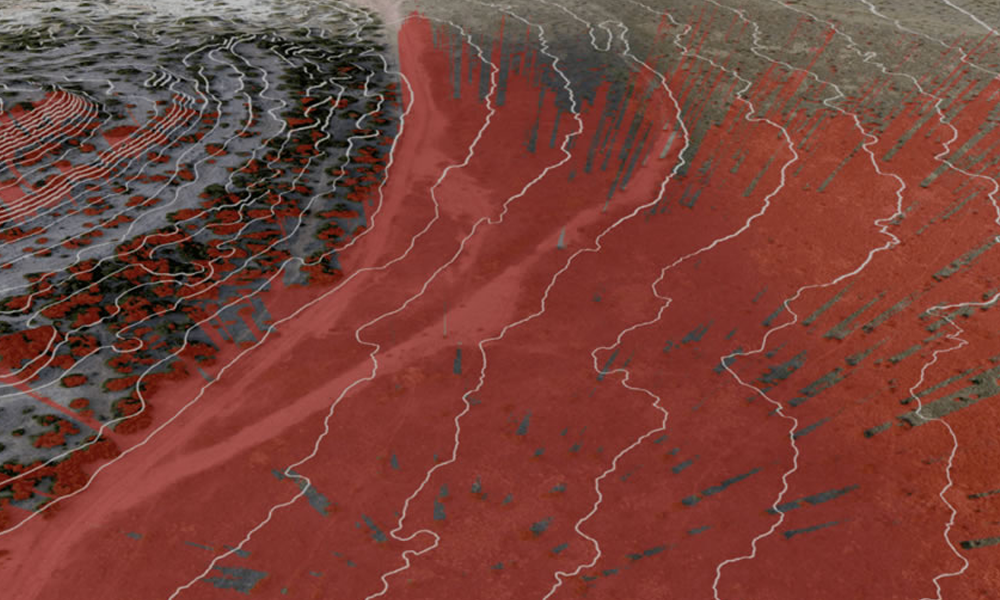
A wildfire risk map is a visual representation of areas that are most susceptible to wildfires. It shows potential risks and hazards, including the likelihood of ignition and how a fire will spread across the underlying terrain. The map is often color-coded to indicate varying degrees of fire risk, ranging from low to high, with red typically indicating the highest level of risk.
Modeling Fire Risk Using Aerial Imagery & GIS Processing
GIS-based models for fire risk assessment use Geographic Information Systems (GIS) data processing to identify and analyze areas with a high potential for wildfire. This data is combined with analysis tools such as Multi-Criteria Decision Analysis (MCDA) or Frequency Ratio (FR) to create an accurate map that shows the risk of fire in a particular area. The models consider factors such as slope, elevation, aspect, land use data, vegetation type, climate conditions, human development, and historical trends.
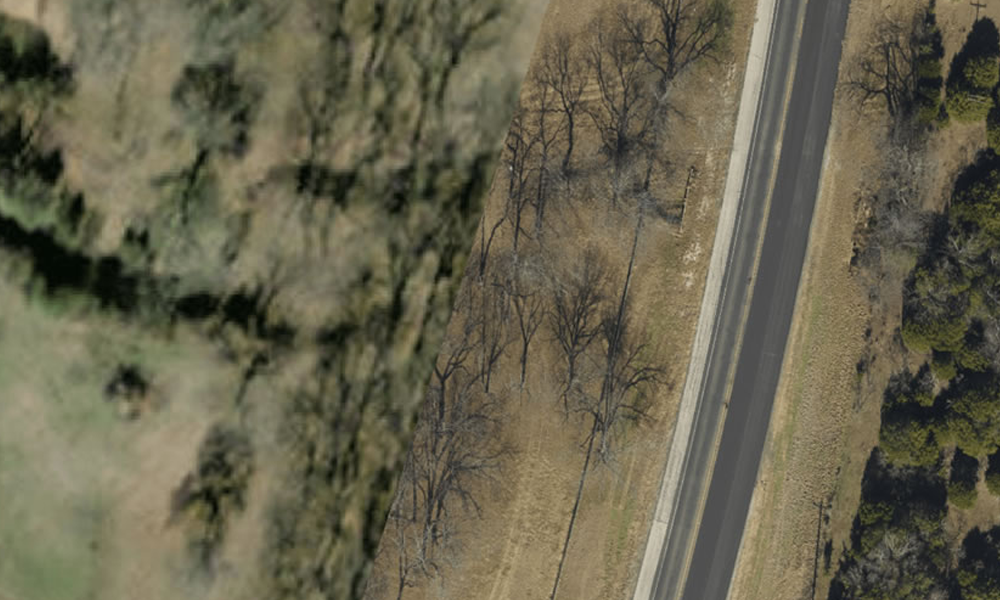
Aerial photography is increasingly being used to deliver the specialized imagery required for fire risk map development. Fixed-wing aerial provides a much higher resolution than satellite imagery and can capture details such as topography and land use in greater detail. This allows for a more accurate assessment of vegetation health and other conditions that can contribute to wildfire risk.
- RGB imagery can be used in Digital Surface Modeling to show surface vegetation, buildings, and other man-made or natural structures. Combined with Digital Elevation Modeling, RGB imagery delivers baseline insight on underlying terrain.
- 4-band imagery is useful for assessing vegetation conditions as it uses near infrared, red, green, and blue wavelengths.
- LiDAR is an active sensing technique that emits laser pulses and measures the reflected signal to generate accurate 3D images of the environment. LiDAR gathers highly detailed information about terrain features and vegetation conditions, which are essential for assessing wildfire risk. Additionally, it can help identify potential firebreaks that could be used as control lines.
Whether the imagery is generated from RGB, 4-band, or LiDAR, fire risk modeling utilizing aerial imagery and GIS processing enables areas at risk of wildfires to be identified quickly and efficiently.
Fire Maps for Emergency Response
Fire maps are critical to planning and coordinating evacuation routes in response to wildfires. During active fires, emergency response authorities use the data to make decisions about where best to send resources. Fire risk maps can also be extremely useful in planning controlled burns. Controlled burning, also known as prescribed fire, is a proactive measure used to reduce wildfire risk by reducing the amount of fuel available to wildfires. By carefully burning vegetation under controlled conditions, fire managers can mitigate the risk of unplanned fires, ultimately leading to a safer and healthier environment.
Fire Maps for Better Industrial Planning
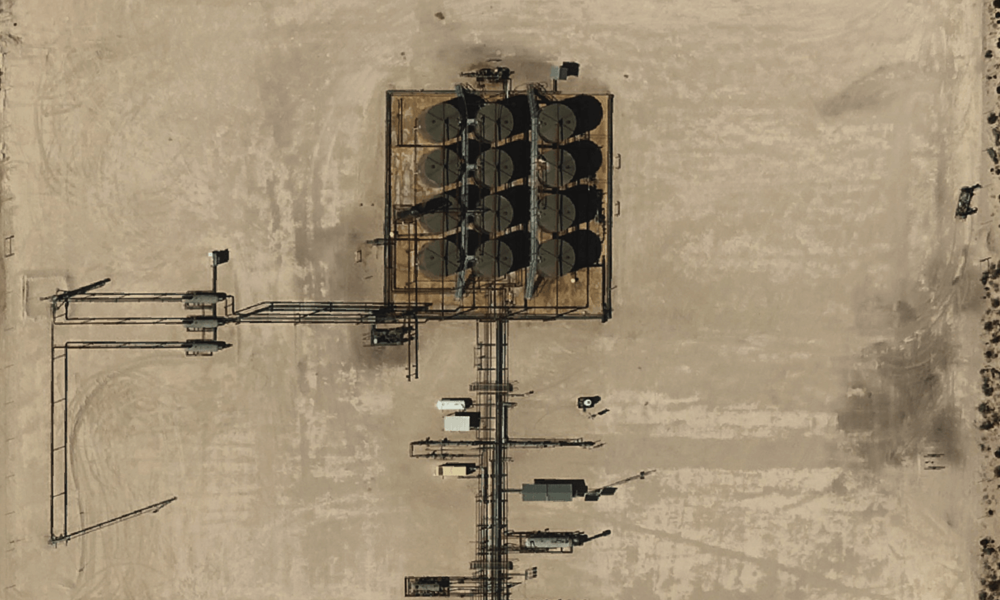
For industries including utilities, construction, and energy exploration, fire risk maps deliver the intel needed to assess the safety of operations. A fire risk map detailing an area of interest provides a roadmap on how best to take appropriate measures to reduce the potential for fires as well as mitigate the effects should one occur.
- Identify high-risk activity areas where extra precautions should be taken – or pinpoint areas that should be avoided completely.
- Implement safety measures such as increased monitoring of vegetation and establishing access roads, water supply points, and other infrastructure that can be used during a wildfire event.
- Develop emergency response plans that include evacuation routes and post-fire recovery strategies.
Proactive Action is Key to Mitigating Damage
Fire risk mapping is a powerful tool in the fight against wildfires. It provides essential information that can be used to evaluate the level of risk posed by vegetation types and land cover conditions. By understanding these risks, proactive action can be taken to reduce impact and mitigate the harmful effects of uncontrollable wildfire outbreaks. In an increasingly fire prone world, having access to detailed and accurate maps has never been more important. With this knowledge, government and private entities alike are better equipped to keep people, property, and the environment safe from the devastating damage caused by wildfires.
Wildfires in the United States can have a devastating impact on people, property, and the environment. Wildfire risk maps may hold the key to helping mitigate costly damage.
The costs are significant. The five-year average cost to the Forest Service alone is over $2 billion, while the cost to Department of Interior (DOI) agencies was more than $525 million. Suppression costs for nine wildfires designated as major disasters from 2016 to 2020 averaged $394 million for hazard-mitigation efforts.
But the devastating effect of wildfires goes way beyond money lost. The destruction of homes, displacement of people from their communities, damage to animal and plant species, and loss of habitat for endangered species are some of the major non-monetary costs associated with wildfires.
What can be done to help limit loss? Fire risk maps help government agencies and private entities alike to better understand potential wildfire impacts and develop effective strategies for prevention and mitigation. These maps provide detailed information about vegetation types and land cover characteristics that can be used to identify areas most vulnerable to wildfire activity or areas where fuel management activities may be needed to reduce risk levels.
A wildfire risk map is a visual representation of areas that are most susceptible to wildfires. It shows potential risks and hazards, including the likelihood of ignition and how a fire will spread across the underlying terrain. The map is often color-coded to indicate varying degrees of fire risk, ranging from low to high, with red typically indicating the highest level of risk.
Modeling Fire Risk Using Aerial Imagery & GIS Processing
GIS-based models for fire risk assessment use Geographic Information Systems (GIS) data processing to identify and analyze areas with a high potential for wildfire. This data is combined with analysis tools such as Multi-Criteria Decision Analysis (MCDA) or Frequency Ratio (FR) to create an accurate map that shows the risk of fire in a particular area. The models consider factors such as slope, elevation, aspect, land use data, vegetation type, climate conditions, human development, and historical trends.
Aerial photography is increasingly being used to deliver the specialized imagery required for fire risk map development. Fixed-wing aerial provides a much higher resolution than satellite imagery and can capture details such as topography and land use in greater detail. This allows for a more accurate assessment of vegetation health and other conditions that can contribute to wildfire risk.
- RGB imagery can be used in Digital Surface Modeling to show surface vegetation, buildings, and other man-made or natural structures. Combined with Digital Elevation Modeling, RGB imagery delivers baseline insight on underlying terrain.
- 4-band imagery is useful for assessing vegetation conditions as it uses near infrared, red, green, and blue wavelengths.
- LiDAR is an active sensing technique that emits laser pulses and measures the reflected signal to generate accurate 3D images of the environment. LiDAR gathers highly detailed information about terrain features and vegetation conditions, which are essential for assessing wildfire risk. Additionally, it can help identify potential firebreaks that could be used as control lines.
Whether the imagery is generated from RGB, 4-band, or LiDAR, fire risk modeling utilizing aerial imagery and GIS processing enables areas at risk of wildfires to be identified quickly and efficiently.
Fire Maps for Emergency Response
Fire maps are critical to planning and coordinating evacuation routes in response to wildfires. During active fires, emergency response authorities use the data to make decisions about where best to send resources. Fire risk maps can also be extremely useful in planning controlled burns. Controlled burning, also known as prescribed fire, is a proactive measure used to reduce wildfire risk by reducing the amount of fuel available to wildfires. By carefully burning vegetation under controlled conditions, fire managers can mitigate the risk of unplanned fires, ultimately leading to a safer and healthier environment.
Fire Maps for Better Industrial Planning
For industries including utilities, construction, and energy exploration, fire risk maps deliver the intel needed to assess the safety of operations. A fire risk map detailing an area of interest provides a roadmap on how best to take appropriate measures to reduce the potential for fires as well as mitigate the effects should one occur.
- Identify high-risk activity areas where extra precautions should be taken – or pinpoint areas that should be avoided completely.
- Implement safety measures such as increased monitoring of vegetation and establishing access roads, water supply points, and other infrastructure that can be used during a wildfire event.
- Develop emergency response plans that include evacuation routes and post-fire recovery strategies.
Proactive Action is Key to Mitigating Damage
Fire risk mapping is a powerful tool in the fight against wildfires. It provides essential information that can be used to evaluate the level of risk posed by vegetation types and land cover conditions. By understanding these risks, proactive action can be taken to reduce impact and mitigate the harmful effects of uncontrollable wildfire outbreaks. In an increasingly fire prone world, having access to detailed and accurate maps has never been more important. With this knowledge, government and private entities alike are better equipped to keep people, property, and the environment safe from the devastating damage caused by wildfires.

