GIS Change Detection Helps Utilities Identify Potential Problems
GIS Change Detection Helps Utilities Identify Potential Problems
GIS Change Detection Helps Utilities Identify Potential Problems
GIS Change Detection Helps Utilities Identify Potential Problems

For utility companies, an aerial imagery and GIS-driven change detection strategy delivers efficient and invaluable insight on land use changes, infrastructure damage, vegetation growth, and more. This helps them to detect potential problems before they become serious headaches, allowing them to take proactive steps to nip potential issues in the bud.
How GIS Change Detection Works
Change detection is a fundamental application of aerial imagery and remote sensing. It involves the comparison of multiple raster datasets to identify changes in the environment. Change detection algorithms operate on a pixel-by-pixel basis to accurately detect pixels that have changed while avoiding incorrectly identifying pixels that have not changed.
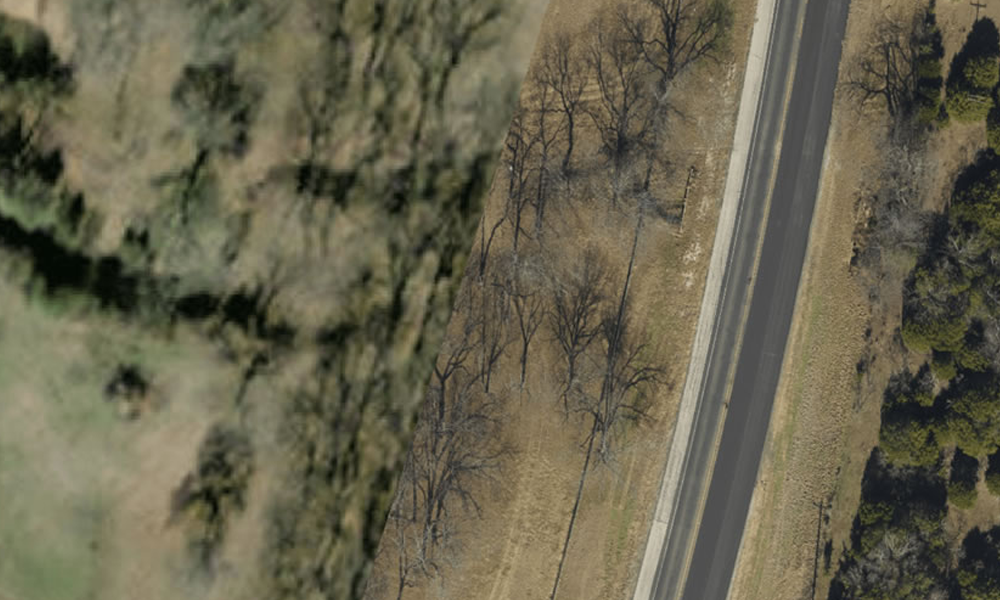
The process begins by acquiring multiple images at different points in time, which are then pre-processed into orthoimagery to correct any errors or distortions caused by atmospheric conditions or other factors. The orthophotos are then compared using various methods such as image differencing and image segmentation. Image differencing involves subtracting one image from another to create a difference image that highlights areas of change. Image segmentation involves dividing an image into smaller regions and analyzing each region for differences between the two images.
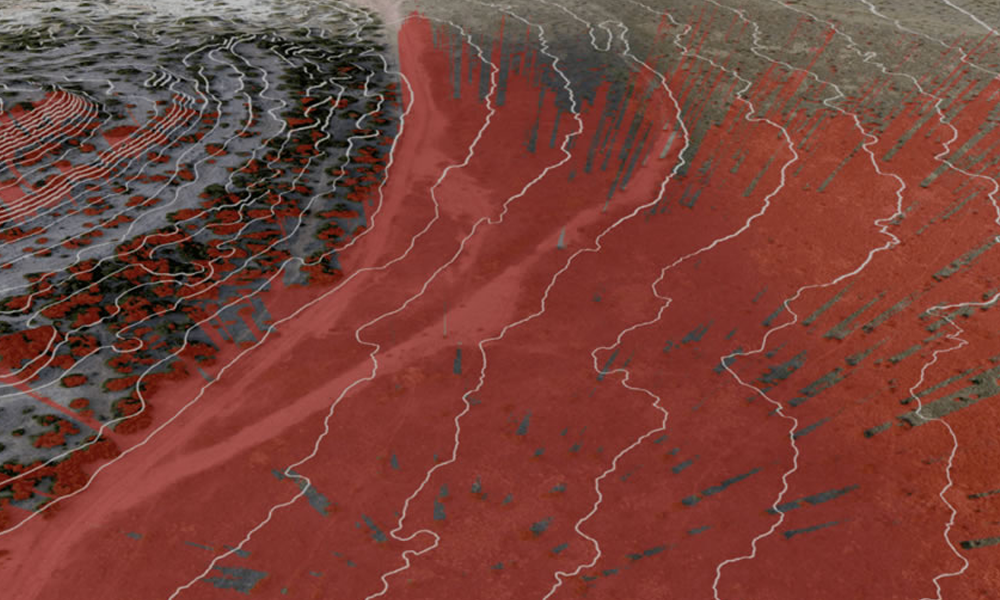
Differencing and segmentation methods can also be conducted on elevation data like digital surface models (DSMs) and digital elevation models (DEMs). These models are created from RGB orthoimagery using a process called photogrammetry. The images are then processed using specialized software that analyzes the images and extracts information about elevation and terrain features.
- To create a DSM, the software processes the imagery to create a 3D model of the terrain and any objects on it. This model includes all the features that impact elevation, such as buildings, trees, and other structures. The resulting DSM represents the top-most surface of the area, including all the features at the surface level.
- To create a DEM, the software processes the imagery to remove all the surface features such as buildings, trees, and other structures, leaving only the bare earth. This results in a model that represents the elevation of the terrain only.
It’s worth noting that the accuracy of DSMs and DEMs depends on the quality of the orthoimagery used as input. High-resolution imagery with accurate georeferencing will result in more precise and reliable models.
Utilities & Change Detection
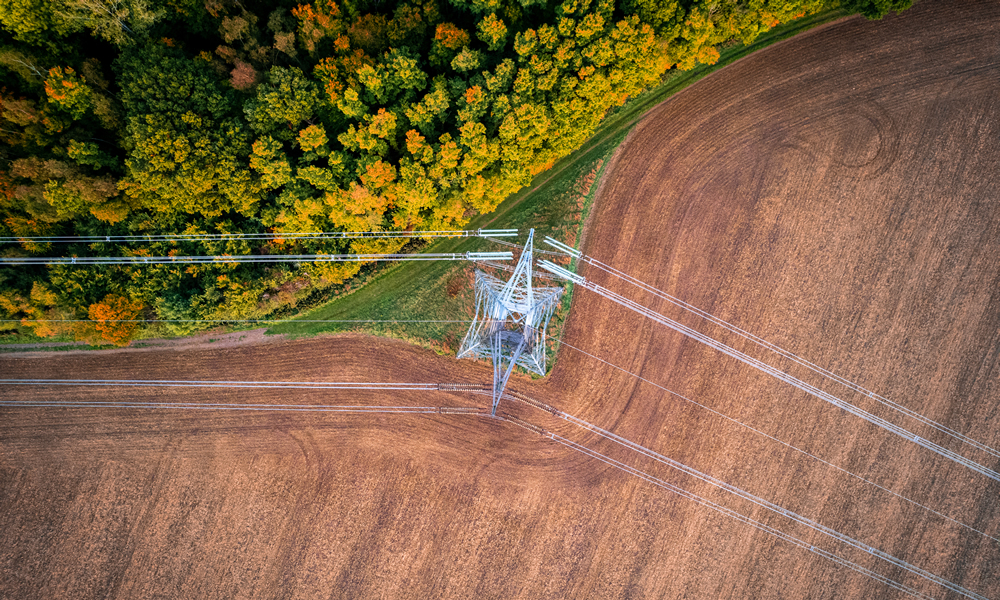
Utilities are increasingly turning to regular scheduled aerial imagery and GIS software to stay ahead of potential issues, while also allowing them to identify opportunities for improvement. By leveraging the power of geospatial data, utilities can quickly and accurately detect changes in land use, vegetation, infrastructure, and more.
- Read how utility vegetation management using aerial orthophotography can prevent fines, protect lines.
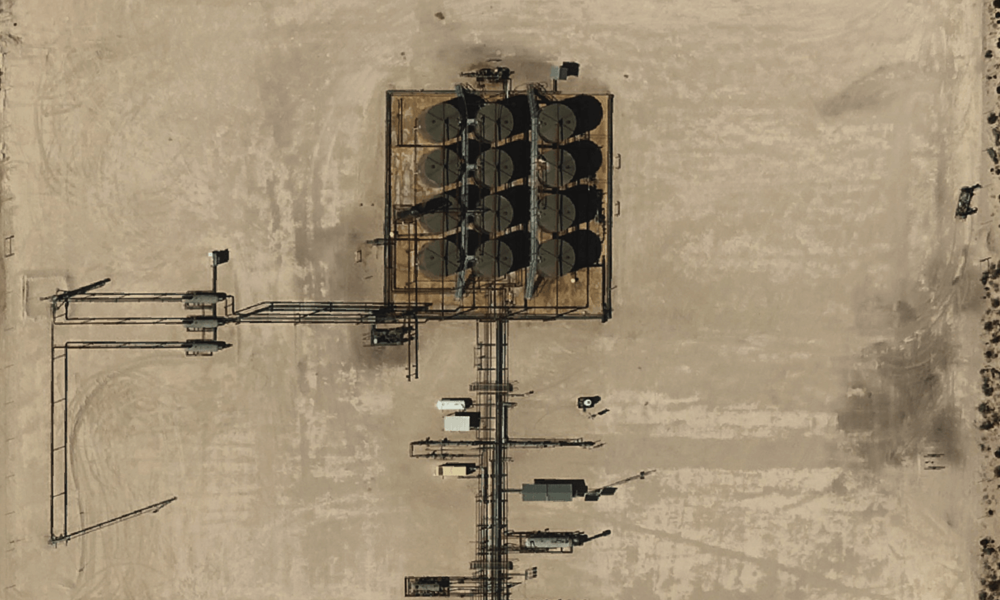
Utility companies can benefit from using GIS-driven change detection in a variety of ways. For example, they can use it to detect changes in land use patterns over time, such as new construction or vegetation growth. They can also use it to monitor the condition of their infrastructure and detect any changes that may indicate a need for maintenance or repairs. Additionally, GIS-driven change detection can be used to identify areas that are at risk of flooding or other natural disasters, allowing utility companies to take proactive steps to protect their assets.
How Often Should an Area of Interest (AOI) be Flown?
Up to date imagery is the key to an effective change detection strategy. A good rule of thumb is utilities should have their areas of interest flown at least once a year. In doing so, utilities can track any changes that may occur and take the necessary steps to address them. This could include anything from detecting new construction or vegetation growth to identifying potential geohazards such as sinkholes or landslides.
It is important to note that flyover frequency conducted for change detection purposes will depend on the specific needs of each utility. For example, if an area is prone to rapid changes due to natural disasters or other events, then more frequent flights may be necessary.
Implementing a Change Detection Strategy
Utilities have many options for implementing a change detection strategy using aerial imagery and GIS software. From automated change detection tools to deep learning techniques, there are numerous ways for utilities to take advantage of this powerful technology. Contact us today to discuss your options.
Conclusion
Change detection technology is helping utilities to stay ahead of the curve when it comes to identifying and responding to potential problems in their Areas of Interest. With GIS-driven analyses, utilities can more proactively – and remotely – detect large and small changes, allowing them to take steps before issues spiral out of control. By better understanding land use, infrastructure damage, and vegetation growth, utilities can respond quickly and effectively when these changes happen. Change detection technology has proven to be a powerful tool in helping utilities make well-informed decisions that maximize safety and efficiency.


