Change Detection: A “Practicable Step” for Monitoring Changing Ground Conditions?
Change Detection: A “Practicable Step” for Monitoring Changing Ground Conditions?
Change Detection: A “Practicable Step” for Monitoring Changing Ground Conditions?
Change Detection: A “Practicable Step” for Monitoring Changing Ground Conditions?

Change detection technology has revolutionized how many industries monitor and analyze changes across their Areas of Interest. Here we explore how GIS change detection may be used to protect ROWs against geohazards and depth of cover issues.
Pipeline safety-related regulatory clauses are riddled with the phrase “must take all practicable steps.” One such example is § 192.317(a) where PHMSA warns that, once new lines are operational, operators “must take all practicable steps to protect each transmission line or main from washouts, floods, unstable soil, landslides, or other hazards that may cause the pipeline to move or to sustain abnormal loads.”
By definition “practicable” means that whatever is being asked is assumed to be capable of being done with “the means at hand and circumstances as they are.”
So, what practicable measures can pipeline operators take today to protect their rights-of-way from ground condition issues that are seemingly impossible to anticipate? Especially when resources are limited, and existing ground crews are already stretched razor-thin?
Change detection technology may hold the key to making monitoring easier.
GIS Change Detection, Geohazards & Depth of Cover
A bedrock application of GIS technology, change detection involves comparing multiple datasets, typically collected at different times or from different sources, to identify changes in an area over time. Depending on the remote sensing data utilized, GIS change detection can analyze geographic features such as terrain, depth of cover, water levels, soil moisture levels, vegetation health, land use and development, and more.
For pipeline operators, the ability to efficiently analyze features on the ground ticks a lot of regulatory boxes.
For monitoring certain geohazard risks, the immediate impact on pipeline integrity management efforts could be profound. While pipe stress monitors can be installed to keep an eye on underground movement, they cannot shed light on what’s going on above ground.
Change detection can.
A simple example is using change detection to monitor landcover change, a culprit in driving erosion. Erosion is a key indicator of landslide and/or sinkhole development.
But pipeline operators aren’t just worried about naturally caused geohazards like landslides. Shifting ground – regardless of what’s causing the shift – has the potential to create major problems.
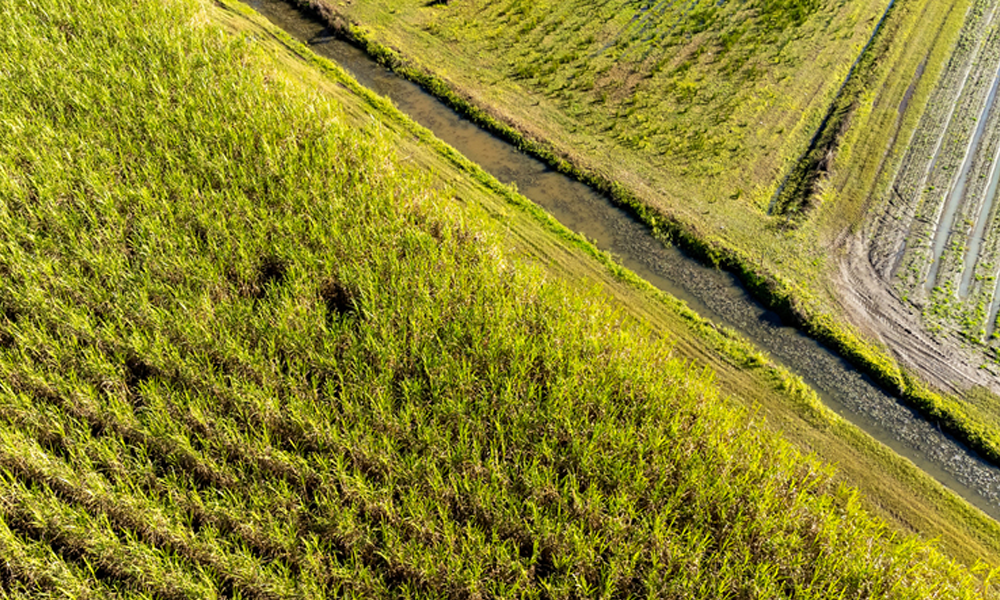
Operators are required to maintain a minimum of 36” depth of cover over a pipeline. Period. In Louisiana, sugar cane farming is notorious for creating depth of cover issues. The cost of inspections for larger midstream companies pushes upwards of $500,000 annually to inspect known areas of impact and replace the missing ground to stay within compliance. If these measures aren’t taken, the operator risks a hefty fine. Change detection simplifies depth of cover oversight with the bonus of providing the data needed to calculate exactly how much fill dirt is required to correct the problem.
With this difficult-to-determine-otherwise knowledge in hand, pipeline operators can make proactive moves to protect their assets. They’ll also enjoy a leg-up on complying with geohazard-related regulatory scrutiny.
How GIS Change Detection Algorithms Work
GIS change detection algorithms work by comparing two sets of geospatial and/or statistical data collected at different times. When comparing imagery, the algorithms operate on a pixel-by-pixel basis to accurately detect pixels that have changed while avoiding incorrectly identifying pixels that have not changed. Changes that can be detected include differences in an object’s shape, size, and location.
Methods of comparison include image differencing and image segmentation. Image differencing involves subtracting one image from another to create a difference image that highlights areas of change. Image segmentation involves dividing an image into smaller regions and analyzing each region for differences between the two images.
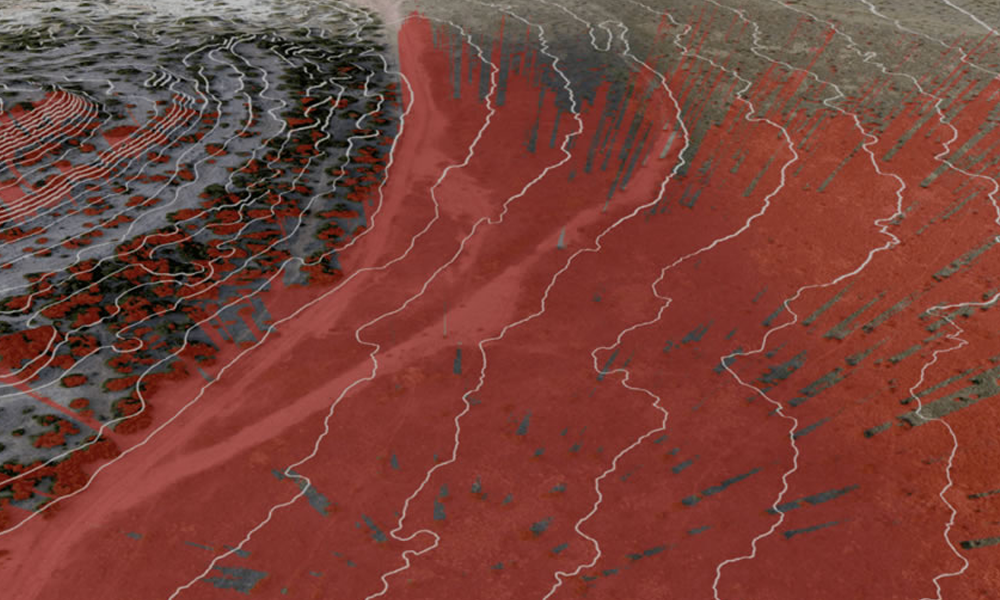
Once changes have been identified, they can be analyzed further using techniques such as change detection statistics or supervised classification. Change detection statistics involve compiling a tabulation of changes between two classification images. Supervised calculation works by using labeled data sets to train a machine-learning model. The model is then able to identify changes in new images by comparing them against the labeled data set. Once the classification process is complete, the sets of data are then compared to detect changes that have occurred between them. The results of this comparison process are then displayed as a change map which allows for detailed analysis of how a particular area has been impacted over time.
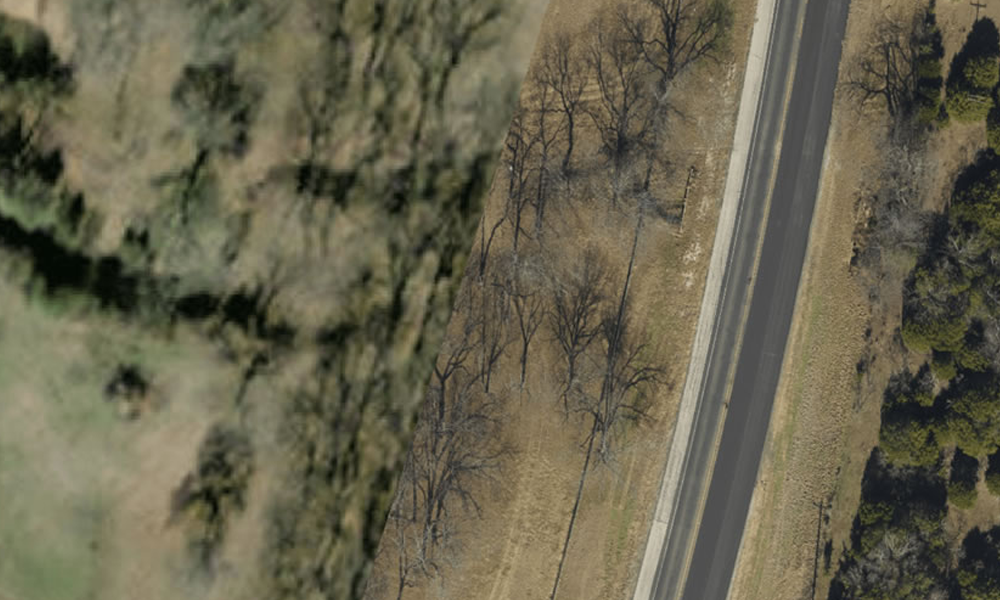
The data used in change detection algorithms can be raster or vector data and can come from LiDAR, aerial photography, or satellite imagery.
Implementing a GIS Change Detection Strategy
To plan and implement a GIS-driven change detection strategy, pipeline operators should follow these steps:
First, identify the areas that need to be monitored for changes. This includes both the physical environment around ROWs as well as any potential human-made changes that could affect it. It may be of benefit to include nearby areas undergoing active excavation for real estate development and/or frequent cultivation.
Second, identify the type of data required. This may include collecting LiDAR, aerial photography, 4-band imagery, or photogrammetry-based elevation data. Once the appropriate data is collected, it should be formatted into a raster or vector format.
Third, determine data collection intervals. Rolling schedules of up-to-date imagery is the key to an effective change detection strategy. A good rule of thumb is to fly pipeline ROWs at least once a year. By having aerial imagery taken at least once a year, pipeline integrity management teams can track ground cover issues and other geohazard risks and take the necessary steps to address them.
- Data Double-Duty: Read how one of the Permian Basin’s largest privately-owned midstream companies uses on-demand aerial imagery to outmaneuver manpower issues and save money on its class location efforts in our Brazos Midstream Project Brief.
For pipelines operating in areas prone to rapid changes due to anything from aggressive land development to heavy cultivation, more frequent flights may be necessary.
Lastly, select an appropriate change detection algorithm to utilize. It’s important to clearly identify what kind of changes need to be detected and whether any other parameters need to be considered, such as time and seasonality. This will help narrow down the list of algorithms that can be used for the application.
It is beneficial to perform test runs with different algorithms in order to determine which one produces the most accurate results. Different algorithms may require different parameters in order for them to work effectively so testing multiple algorithms and seeing which one works best is essential.
Operators should also consider how much time they want or need to spend on setting up and training an algorithm before they can get useful results. Some algorithms may require more manual input than others, and some may take longer than others to train before they can detect changes accurately. By researching these factors ahead of time, operators can make informed decisions about which algorithm will be best suited for their purposes.
- From evaluating available change detection tools to developing deep learning solutions to further fine tune your efforts, our data experts can help. Contact us today to discuss your options.
A Practicable – And Practical – Solution
Change detection technology is revolutionizing the way industries track and monitor changes in the landscape. For midstream players, this innovative technology is a practicable – and practical – solution that enables more efficient geohazard mitigation strategies. By comparing datasets from different sources and times, change detection creates a detailed picture of geographical features which can help pipeline integrity teams size up risk levels effectively and quickly. With change detection, operators can now make proactive decisions rather than responding to emergency events with reactive measures. Ultimately, this technology enables them to better meet regulatory standards while also pre-emptively protecting their pipelines and infrastructure from depth of cover challenges and geohazard risks.


